@schustan0 it should show for Metaplanet too (you need to make sure 3350.T is selected at the top).
With regards to timestamp, it does show below the chart.
Let me know if this helps!
@schustan0 it should show for Metaplanet too (you need to make sure 3350.T is selected at the top).
With regards to timestamp, it does show below the chart.
Let me know if this helps!
The MTPL specific dashboard defaults to NAV against Basic Share (if you click on the blue metric above the chart, it will also show NAV against Diluted Share)
The comparison dashboard always defaults to NAV against Diluted Share.
Technically, NAV against Diluted is more correct. Perhaps I need to change the default number shown on the chart in the company dashboard page.
It’s not particularly sophisticated — if a stock jumps 100% in a single day, I see it as exuberance and generally expect some mean reversion. Anything that doubles in a day can just as easily drop 50% the next day.
With that in mind, I decided to lock in some profits by converting some of my position to MSTR, which I consider my core position alongside BTC.
Keep in mind this is done in a non-taxable account, which makes moving in and out frictionless.
Thanks both for the feedback!
I will revamp this chart soon and add it to the comparison tab as well.
Raised the issue here:
https://x.com/MSTR_Tracker/status/1923669773818397136
In the mean time, it just means we will have to report latest buys with a small delay, given their numbers lag slightly behind the announcement.
Updated the numbers in the mean time.
The problem is that when they announced the buy, their analytics dashboard showed 518M.
It's not clear when it became 553 because their announcements don't include share counts as far as I can tell (and their dashboard doesn't always update immediately)
I can update it retroactively to 553 but in order to fix it permanently and ensure accuracy Metaplanet needs to improve its reporting to include historic share counts
I made a Months to cover mNAV chart but it's probably wrong. Didn't test / check the numbers much.
Nonetheless, just putting out there for feedback.
Yes - I removed it at some point because I was not confident about the calculation.
Will add it back in.
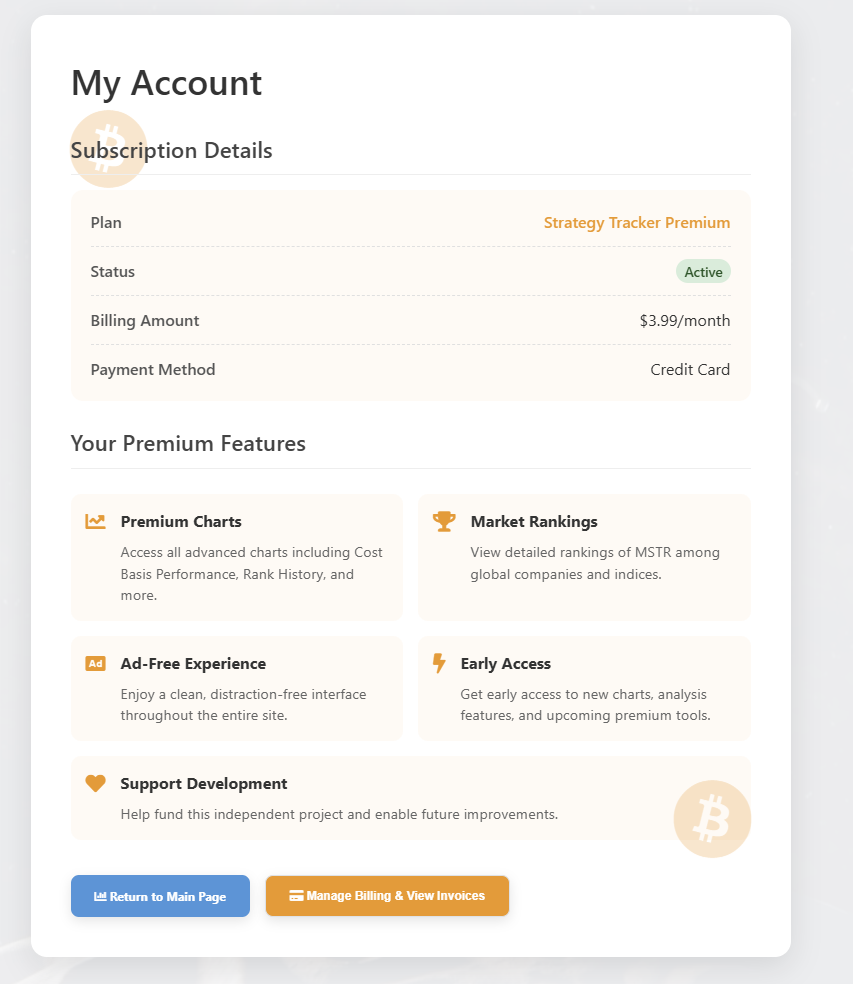
Added self-service functionality so you can see your invoices if you click on "Manage Billing & View Invoices"
Will see if I can optimize it even further!
Thanks again for the feedback and for the support!
One thing to point out is that the metric cards would fit in one row if given enough width (or if you zoom out enough)
Hi Frederic,
Thank you for your feedback!
Just to make sure I understand, is the main concern not having all charts on one page?
What do you think of a multiselect dropdown instead that saves your chart selections and displays them all on one page?
We had limited insight into how people were using the product or what was working and what wasn’t until we enabled the forum and feedback features. Some trial and error is to be expected.
Best,
Radu
